
How to Read Water Pump Curves | Complete Guide to Pump Performance Charts
Learn how to read water pump performance curves, understand flow rate, head height, efficiency, power consumption and select the right pump for your application.
How to Read Water Pump Performance Curves: The Complete Guide
One of the biggest mistakes people make when buying a water pump is choosing a model based solely on its motor size or maximum flow rate. While these specifications are important, they don’t tell the full story.
Professional installers and pump engineers rely on pump performance curves to determine whether a pump is suitable for a particular application. These graphs show how a pump performs under different operating conditions, allowing you to select a model that delivers the right balance of pressure, flow and efficiency.
Whether you’re installing a borehole pump, pressure booster, irrigation system or rainwater harvesting setup, understanding pump curves will help you avoid costly mistakes and ensure reliable performance.
What Is a Water Pump Performance Curve?
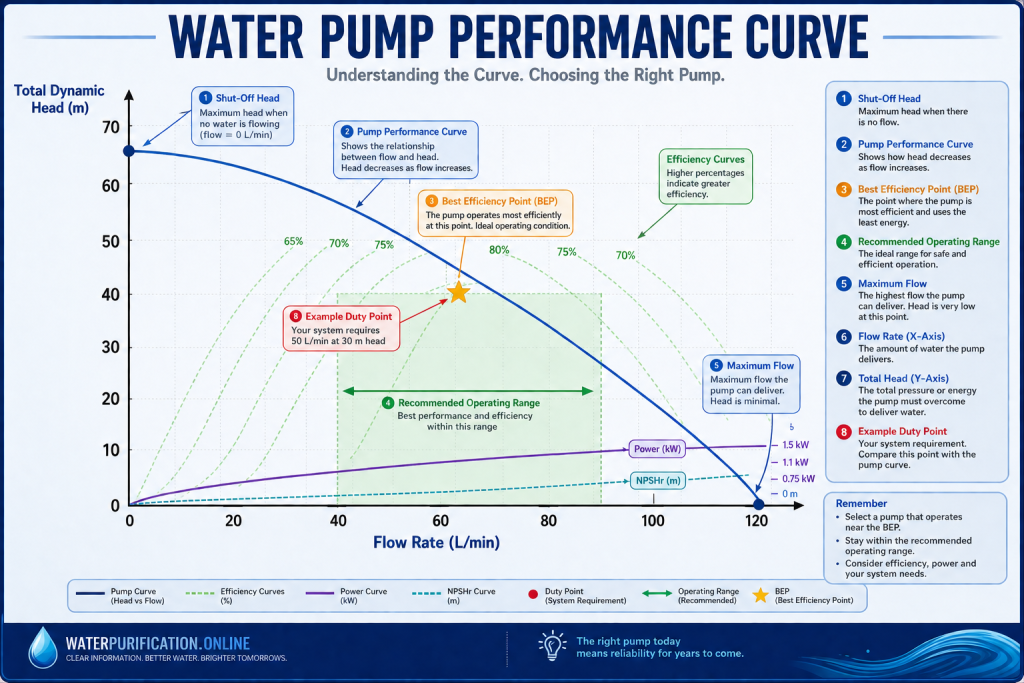
A pump performance curve is a graph supplied by the manufacturer that illustrates how a pump performs under varying conditions. It shows the relationship between flow rate, head height, efficiency, power consumption and, in some cases, Net Positive Suction Head (NPSH).
Think of it as the pump’s “performance map.” Instead of guessing how well a pump will work, the curve allows you to predict its performance at different operating points.
Why Pump Curves Matter
Two pumps with the same motor size can perform very differently. For example, a 1.1 kW centrifugal pump designed for irrigation may deliver high flow at low pressure, while another 1.1 kW pump may produce lower flow but much higher pressure.
Choosing the wrong pump can lead to:
- Low water pressure at taps or sprinklers.
- Excessive electricity consumption.
- Frequent pump cycling.
- Increased wear on seals and bearings.
- Cavitation and reduced lifespan.
- Unsatisfactory system performance.
A pump curve helps you match the pump to your system rather than relying on assumptions.
Understanding the Axes of a Pump Curve
Most pump performance curves are displayed as a graph with two primary axes.
Horizontal Axis (X-Axis): Flow Rate
The horizontal axis shows how much water the pump can move over a specific period.
Common units include:
- Litres per minute (L/min)
- Litres per second (L/s)
- Cubic metres per hour (m³/h)
- Gallons per minute (GPM)
As you move to the right on the graph, the pump delivers more water.
Vertical Axis (Y-Axis): Head Height
The vertical axis shows the total head, usually measured in metres (m). Head represents the amount of energy the pump must provide to move water through the system.
Head includes:
- Vertical lift.
- Pipe friction losses.
- Pressure requirements.
- Resistance from valves and filters.
As head increases, the pump must work harder, which generally reduces the flow rate.
Understanding the Main Pump Curve
The main curve on the graph represents the relationship between flow and head.
A typical curve slopes downward from left to right. This means:
- At zero flow, the pump produces its maximum head (known as the shut-off head).
- As flow increases, the available head decreases.
- Every pump has a practical operating range where it performs best.
This relationship is fundamental to all centrifugal pump designs.
What Is Shut-Off Head?
The shut-off head is the maximum pressure the pump can generate when no water is flowing.
For example, a pump may have a shut-off head of 58 metres. While this sounds impressive, it doesn’t mean the pump can deliver useful water flow at that height. Once water begins moving, the available head decreases according to the pump curve.
Shut-off head should not be used as the sole criterion when selecting a pump.
Understanding the Best Efficiency Point (BEP)
One of the most important features on a pump curve is the Best Efficiency Point (BEP).
The BEP is the point where the pump converts electrical energy into hydraulic energy most efficiently.
Operating near the BEP offers several advantages:
- Lower electricity consumption.
- Reduced vibration.
- Less wear on bearings and seals.
- Longer motor life.
- Lower operating temperatures.
- Improved reliability.
Whenever possible, choose a pump that will operate close to its BEP during normal use.
Efficiency Curves
Many manufacturer charts include efficiency lines expressed as percentages.
For example:
- 50%
- 60%
- 70%
- 75%
- 80%
These contours indicate how efficiently the pump operates at different combinations of flow and head.
A higher efficiency means more of the electrical energy is used to move water rather than being lost as heat or friction.
Power Curves
Pump curves often include a power curve showing how much motor power is required at different operating points.
Power may be shown in:
- Kilowatts (kW)
- Horsepower (HP)
This helps ensure the motor is correctly matched to the pump and prevents overloading.
It also provides a useful indication of expected electricity consumption.
What Is NPSH?
Some pump performance charts include a curve for Net Positive Suction Head Required (NPSHr).
NPSH is a measure of the pressure needed at the pump inlet to prevent cavitation.
Cavitation occurs when water boils due to low pressure, forming tiny vapour bubbles that collapse inside the pump. Over time, this can damage impellers, increase noise and reduce performance.
Submersible borehole pumps generally have fewer NPSH concerns because they operate below the water surface, whereas surface pumps must be carefully designed to ensure adequate suction conditions.
How to Match Your System to a Pump Curve
To choose the correct pump, you need to know two key values:
- Required Flow Rate
- Total Dynamic Head (TDH)
For example:
- Flow required: 60 L/min
- TDH: 35 metres
Locate 60 L/min on the horizontal axis and 35 metres on the vertical axis. The point where these values intersect is your system’s operating point.
If this point falls:
- Close to the BEP, the pump is a good match.
- Outside the pump’s operating range, choose a different model.
- Near the extremes of the curve, efficiency and reliability may be reduced.
Example: Selecting a Pump
Imagine you need to supply a double-storey home from a rainwater storage tank.
Your calculations show:
- Flow requirement: 50 L/min
- Total Dynamic Head: 28 metres
You compare two pumps:
Pump A
- High flow at low head
- BEP at 80 L/min
- Struggles above 20 metres
Pump B
- Designed for medium flow and moderate head
- BEP at 50 L/min and 30 metres
- Operates efficiently within your required range
Although both pumps may have similar motor sizes, Pump B is the better choice because its performance curve closely matches your system requirements.
Common Mistakes When Reading Pump Curves
Avoid these common errors:
- Choosing a pump based only on maximum flow.
- Ignoring total dynamic head.
- Assuming bigger motors provide better performance.
- Operating far from the BEP.
- Forgetting pipe friction losses.
- Confusing static head with total head.
- Ignoring efficiency curves.
- Overlooking future expansion requirements.
Frequently Asked Questions
Can I choose the pump with the highest flow rate?
Not always. High flow without sufficient pressure may not meet your needs. The correct pump balances flow and head for your specific application.
Why does flow decrease as head increases?
As the pump works against greater resistance, more energy is required to overcome that resistance, reducing the volume of water it can deliver.
Is a larger motor always better?
No. An oversized pump can consume more electricity, cycle excessively and wear out more quickly if it operates far from its Best Efficiency Point.
Do all manufacturers publish pump curves?
Reputable manufacturers typically provide performance curves for their pumps. These charts are essential for accurate pump selection and system design.
Conclusion
Water pump performance curves are one of the most valuable tools for selecting the right pump. They provide a clear picture of how a pump will perform under different conditions, helping you avoid undersized or oversized equipment and ensuring efficient, reliable operation.
By understanding flow rate, head height, efficiency, power requirements and the Best Efficiency Point, you can confidently choose a pump that matches your application’s needs. Whether you’re installing a domestic pressure system, borehole pump or irrigation network, reading the pump curve is a critical step toward long-term performance and energy efficiency.
Related Articles
Continue building your knowledge with these guides:
- How to Choose the Right Water Pump
- How to Calculate Total Dynamic Head (TDH)
- Borehole Pump Buying Guide
- Pressure Tanks Explained
- Surface Pumps vs Submersible Pumps
- Common Water Pump Problems and Troubleshooting
- How to Size a Water Pump Correctly
- Understanding Water Pressure in Residential Plumbing